P-values and Posterior Probabilities
Given a p-value of 0.045 what is the probability that the null model is true? The answer will surprise you!

You might want to argue that the question in the subtitle is based on a false premise; the p-value is related to the probability of falsely rejecting the null hypothesis conditional on the level () and the null hypothesis being true. The question of whether the null-model valid or not is only assessed from this viewpoint and we certainly cannot assign a probability it.
However in Bayesian statistics such a question is perfectly valid. The theory of Bayesian robustness examines how sensitive a Bayesian inference is to the choice of prior. Thereby addressing one of the main criticisms of Bayesian statistics. In a seminal paper, James O. Berger and Thomas Sellke consider a single realization (the results still holds for multiple realizations) of a normal variable with known variance:
and a test for the hypothesis
against the alternative
Let’s also phrase a Bayesian model; we give each of the two models an equal prior probability We also need a prior for under , . Berger and Sellke shows that if corresponding to a p-value less than 0.32, the prior favoring the most within the class of symmetric unimodal distributions is a uniform distribution,
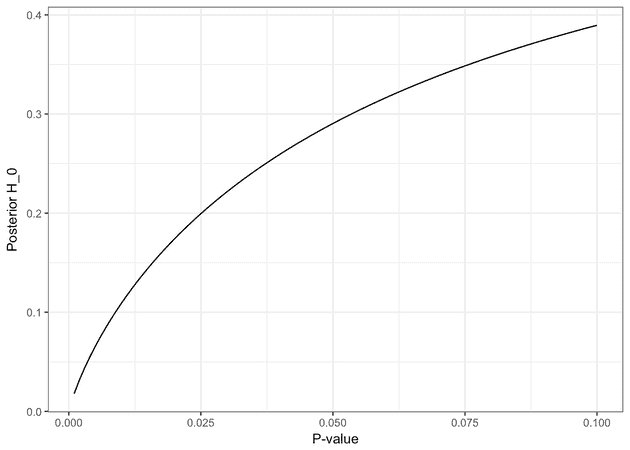
We find the that maximizes the posterior probability of the alternative for different values of and their corresponding posterior probabilities and p-values.
| P-value | Posterior of H0 |
|---|---|
| 0.100 | 0.3895459 |
| 0.050 | 0.2904357 |
| 0.010 | 0.1094489 |
| 0.001 | 0.0177166 |
This answers our question: With the prior that favors the alternative the most the posterior probability that the null hypothesis is true for a p-value of 0.045 is still 0.28. Not exactly overwhelming evidence for the alternative.
Below we have plotted the posterior probability for against the p-value for the prior that favors the alternative the most.
